BTC-USD $83,493.90 -0.89% ETH-USD $2,686.01 +0.24% SOL-USD $118.52 -2.59% XRP-USD $1.49 -1.26% ADA-USD $0.25 -3.23%

Module 4 of 9 · 8:25

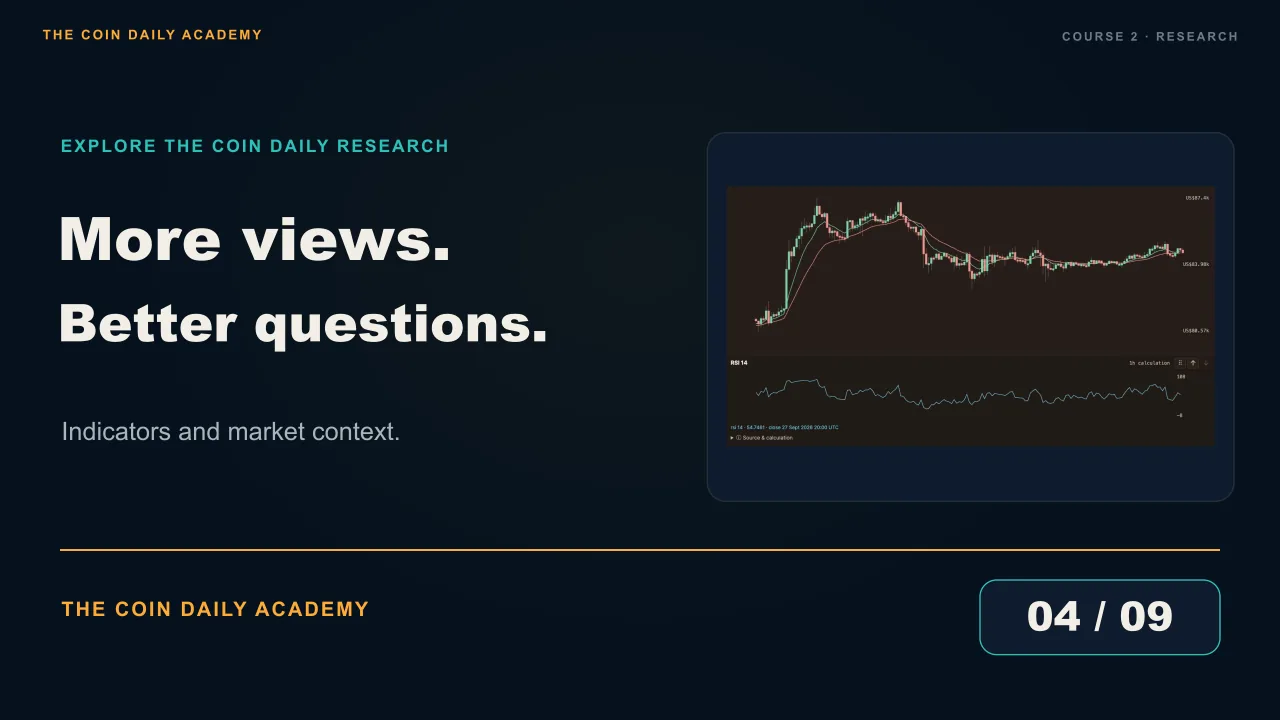
More views. Better questions.

Explore trend and momentum indicators, then add volume, open interest, funding, liquidations, liquidity, account groups and recorded market conditions. Learn what each view adds and how to keep the chart readable.

Play here loads YouTube’s privacy-enhanced player. Watch on YouTube ↗

Chapters in this module
  1. Intro
  2. Pair trend with momentum
  3. Choose the view for your question
  4. Add activity and positioning
  5. Look inside liquidity and account groups
  6. Explore changing market conditions
  7. Build a view you can use

In this module

  • Choose indicators and layers for the question you are exploring.
  • Distinguish trading activity, derivatives exposure, funding and available quotes.

What to look for

  • EMA and SMA simplify price direction; RSI and CCI add momentum context; ATR describes range size and ADX describes trend strength.
  • Read each layer with its source and units. Account shares are different from position size; quoted liquidity is different from completed trades.
  • Keep the views that help answer your question and remove the rest.

Ready to move on?

Mark this module complete when you have finished the video and reviewed the key ideas.

General education, not personal investment advice. Examples illustrate concepts; they are not recommendations or forecasts.