BTC-USD $83,493.90 -0.89% ETH-USD $2,686.01 +0.24% SOL-USD $118.52 -2.59% XRP-USD $1.49 -1.26% ADA-USD $0.25 -3.23%

Module 3 of 9 · 5:19

Bring the chart to life

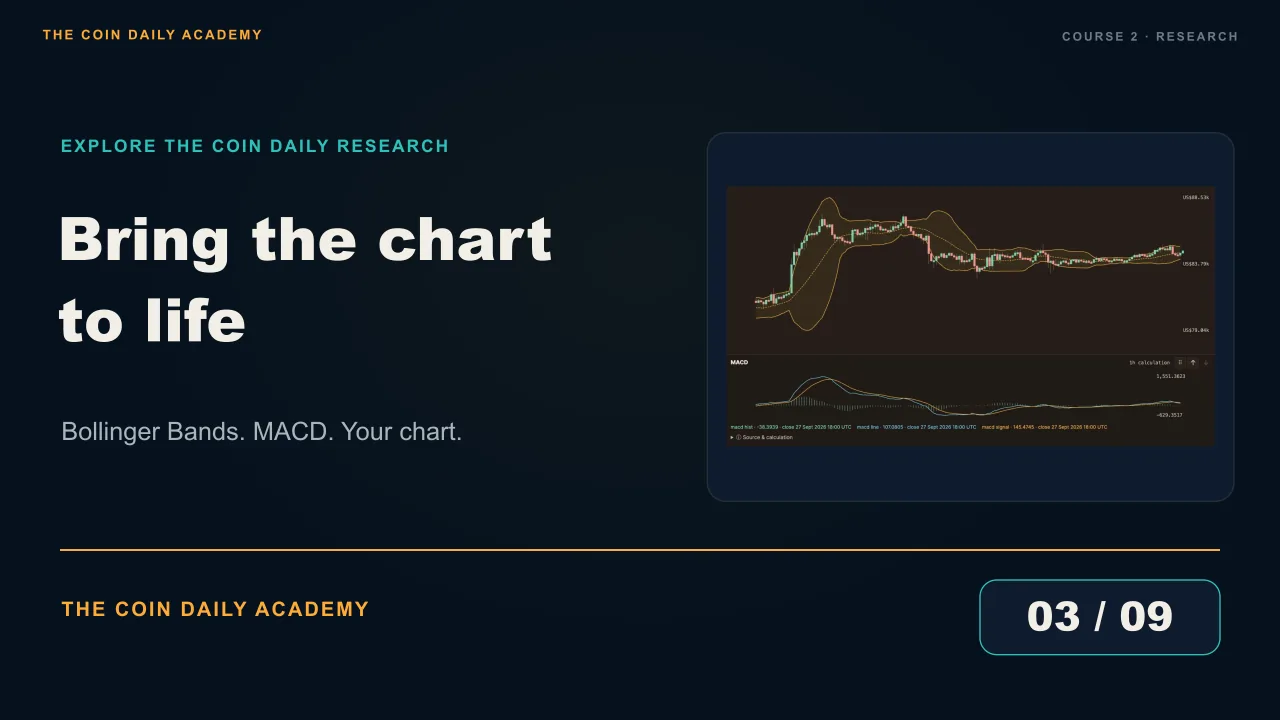
Add Bollinger Bands and MACD, see what each helps you assess, and compare two points on your own chart. Explore how changing the candle interval changes the view.

Play here loads YouTube’s privacy-enhanced player. Watch on YouTube ↗

Chapters in this module
  1. Intro
  2. Add Bollinger Bands
  3. Add a momentum view
  4. Compare your own A and B
  5. Change the candle interval
  6. Read the selected range

In this module

  • Add and interpret the purpose of Bollinger Bands and MACD.
  • Compare your own A and B and change the candle interval.

What to look for

  • Bollinger Bands help assess changing price variation and price position around a moving average.
  • MACD adds a momentum view. Period settings count candles at the interval you select.

Try it yourself

Add both indicators to your own chart, then compare two points you choose.

Ready to move on?

Mark this module complete when you have finished the video and reviewed the key ideas.

General education, not personal investment advice. Examples illustrate concepts; they are not recommendations or forecasts.