BTC-USD $83,493.90 -0.89% ETH-USD $2,686.01 +0.24% SOL-USD $118.52 -2.59% XRP-USD $1.49 -1.26% ADA-USD $0.25 -3.23%

Module 5 of 9 · 8:32

Explore the wider market

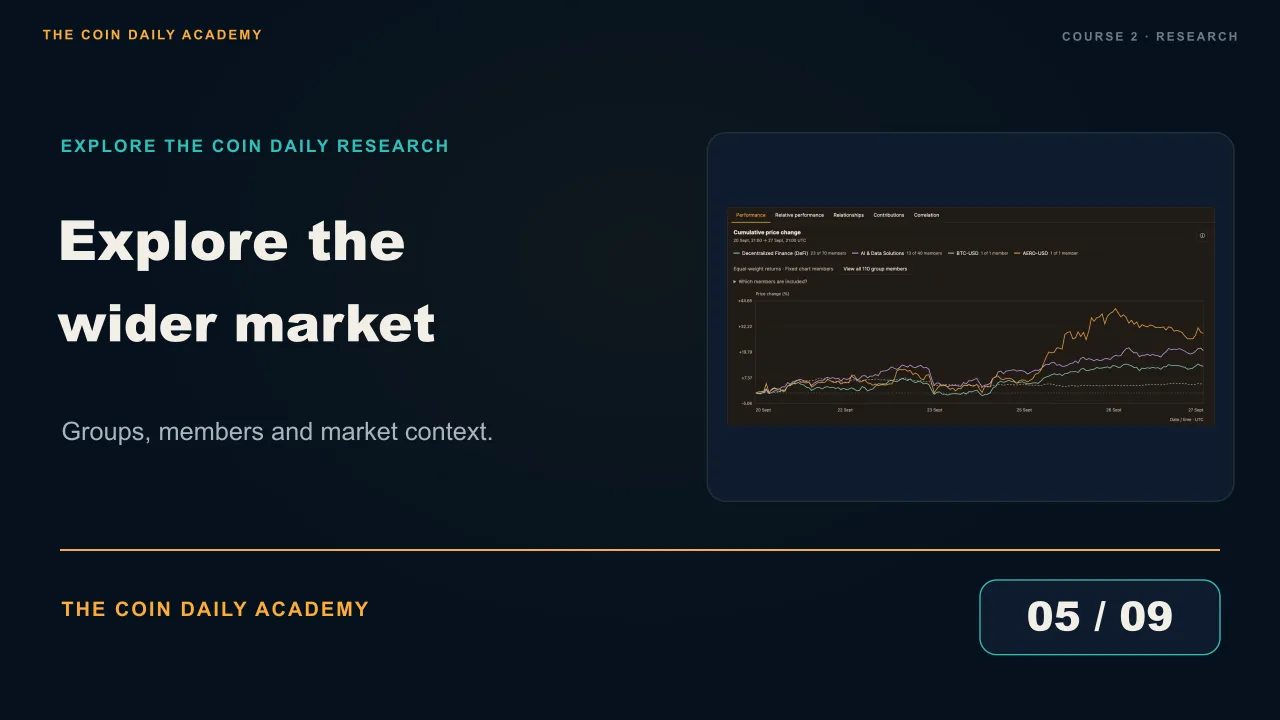
Move from the Market Board to asset categories and Cohorts. Compare group performance against Bitcoin, find contributing members, inspect relationships and correlation, and replay the recorded paths.

Play here loads YouTube’s privacy-enhanced player. Watch on YouTube ↗

Chapters in this module
  1. Intro
  2. Find what stands out
  3. Know what is in the group
  4. Compare the group moves
  5. Find the members driving it
  6. Compare activity and co-movement
  7. Follow the move through time

In this module

  • Compare groups, their members and a benchmark.
  • Use contributions, relationships, correlation and replay for different questions.

What to look for

  • The groups use current membership and equal-weight returns from comparable chart members. Read the member counts in the legend.
  • Relative performance subtracts the benchmark return in percentage points. A member contribution also includes its weight in the group.
  • Replay reveals the loaded history; it does not recreate everything known at the time.

Ready to move on?

Mark this module complete when you have finished the video and reviewed the key ideas.

General education, not personal investment advice. Examples illustrate concepts; they are not recommendations or forecasts.