BTC-USD $83,493.90 -0.89% ETH-USD $2,686.01 +0.24% SOL-USD $118.52 -2.59% XRP-USD $1.49 -1.26% ADA-USD $0.25 -3.23%

Module 9 of 9 · 5:58

Bring it all together

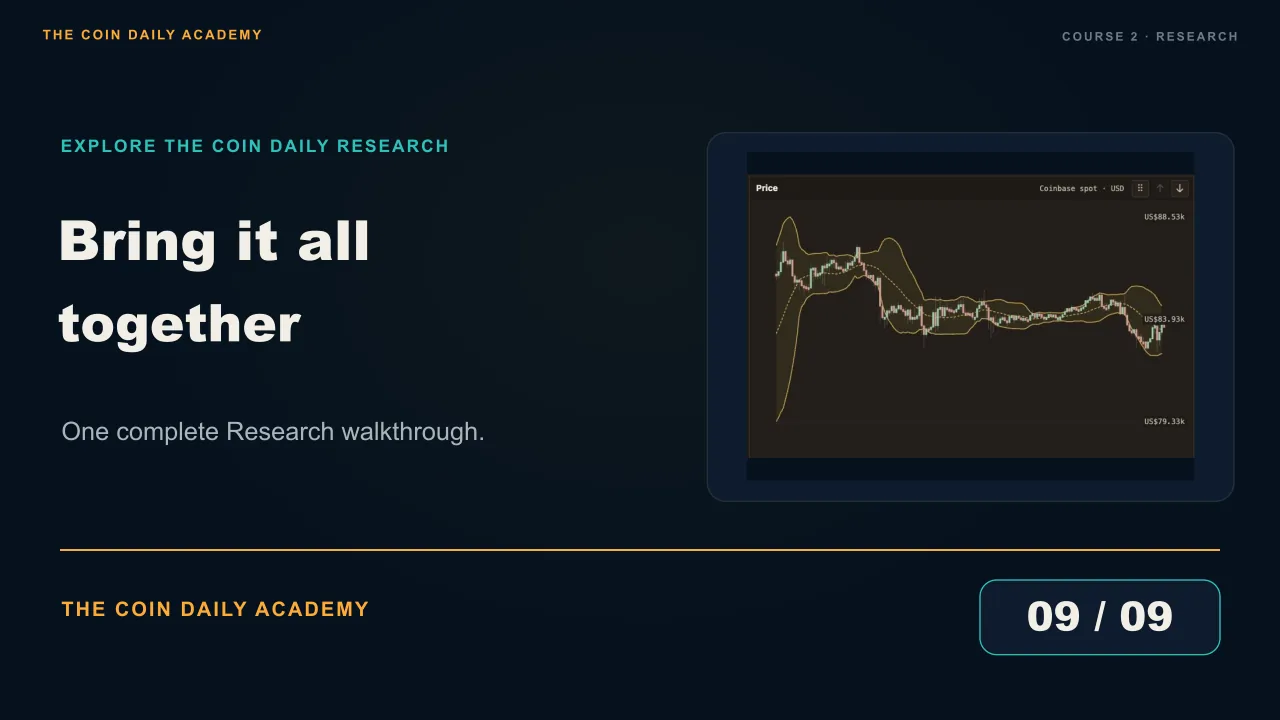
Follow one complete route through Research: find Bitcoin, add Bollinger Bands, compare two candles, explore topic bubbles and source stories, play a ticker show chapter and compare the wider market.

Play here loads YouTube’s privacy-enhanced player. Watch on YouTube ↗

Chapters in this module
  1. Intro
  2. Find your starting point
  3. Explore and measure the move
  4. Follow the news context
  5. Open the relevant video
  6. Step back to the wider market
  7. Keep exploring

In this module

  • Connect chart, comparison, news, video and group views in one workflow.
  • Let the next question guide which view you open.

What to look for

  • The chart, supporting measures, news and video each answer a different question. Choose the view that helps you explore the next one.
  • The cohort comparison uses its own stated period, separate from the earlier A–B selection.
  • Choose an asset or topic that catches your attention and keep exploring.

Ready to move on?

Mark this module complete when you have finished the video and reviewed the key ideas.

General education, not personal investment advice. Examples illustrate concepts; they are not recommendations or forecasts.