
Prompts to copy
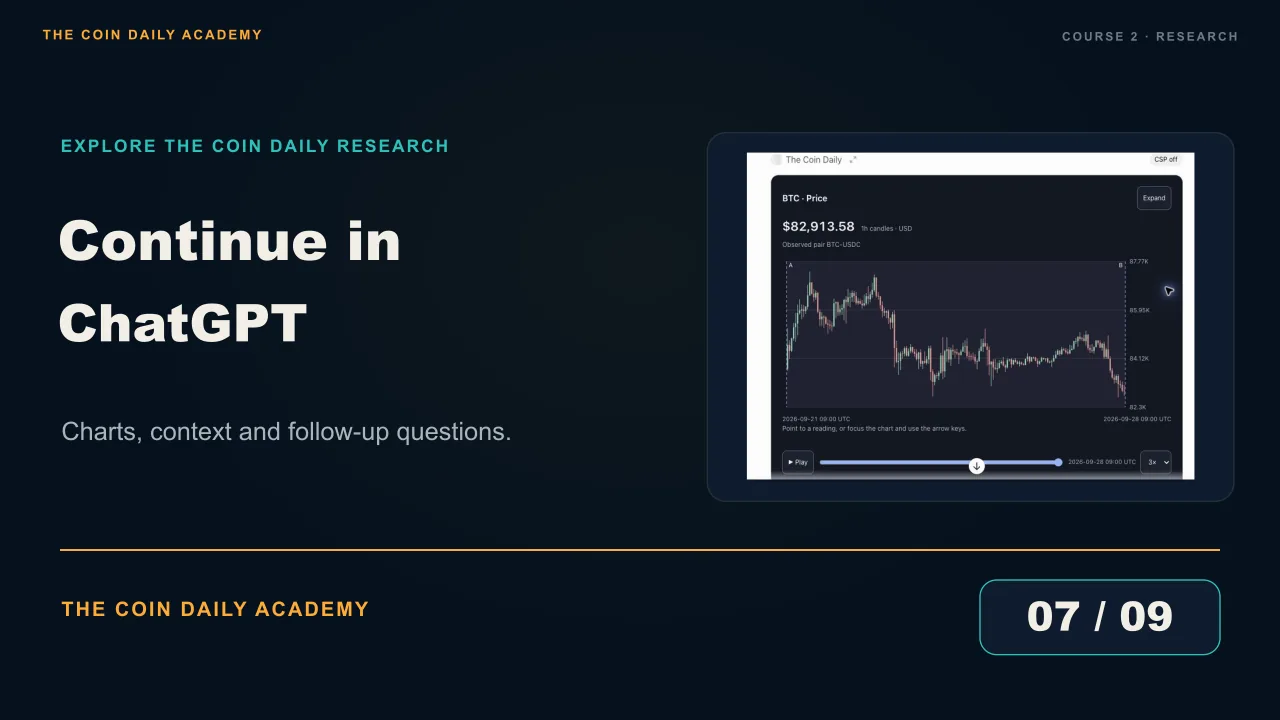
- Show a Bitcoin price chart for the latest seven days, with one-hour candles. Use the native interactive chart and include source and coverage.
- Add an interactive funding chart for Bitcoin over the same seven days. Keep the source and units visible.
- What changed in price and funding across the full seven-day window? Explain the main contrast in plain English, and suggest one useful next view.
- Show that open-interest view.
Select the connection name you chose during setup; the recording uses The Coin Daily.